Roadmap
Where we’re going
Hands-on data courses. R, Python and SQL today; more data tools on the way.
- NowLive
R, dplyr, ggplot2 and SQL. Open a course and start learning.
- NextBeing built
Intro to Python and tips that help you find your way around a lesson.
- LaterPlanned
More ways to analyse data, build models and share what you find.
The courses
Curriculum
Now
LiveStart with a question. Finish with an answer.
Intro to R
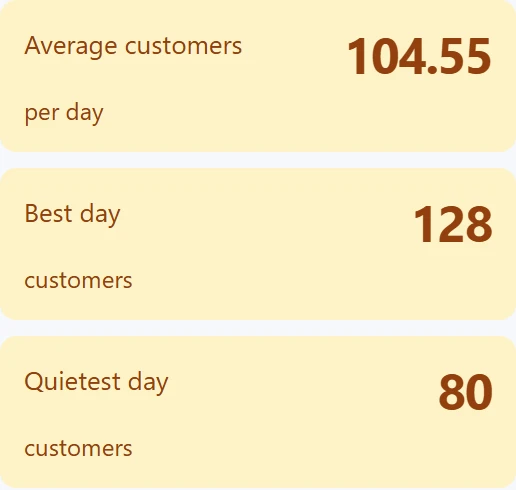
Report a store’s average revenue and best day, then plot its sales.
12 lessons live
dplyr
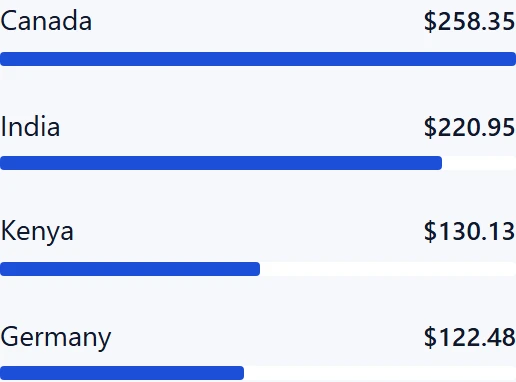
Turn sales and store data into four tables for a Monday board report.
15 lessons live
ggplot2
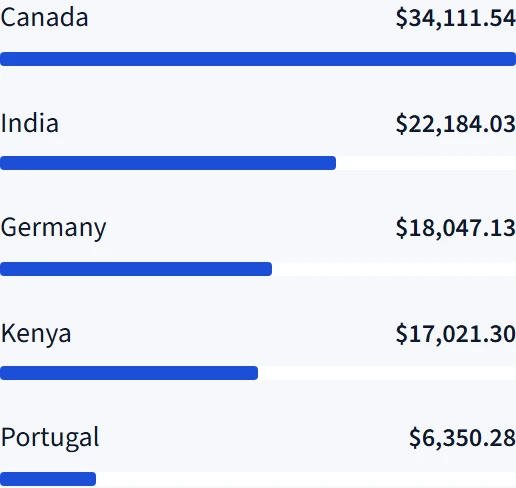
Build a board page with revenue bars, wait boxplots and daily sales lines.
13 lessons live
Intro to SQL
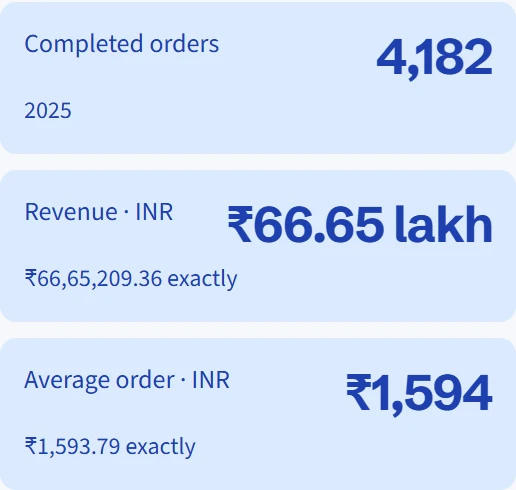
Ask a shop’s database a question and get a table back as the answer.
13 lessons live


Next
Being built
Intro to Python
Calculate order amounts and finish with a first sales chart.
Later
PlannedAnalysis
- Excel
- Statistics for Analysts
- Domain tracks
Machine learning
- AI for Data Analysts
- Data Science & Machine LearningExploring
Engineering & BI
- BI dashboards
The learning experience
Platform
Now
LiveA little help at every step.
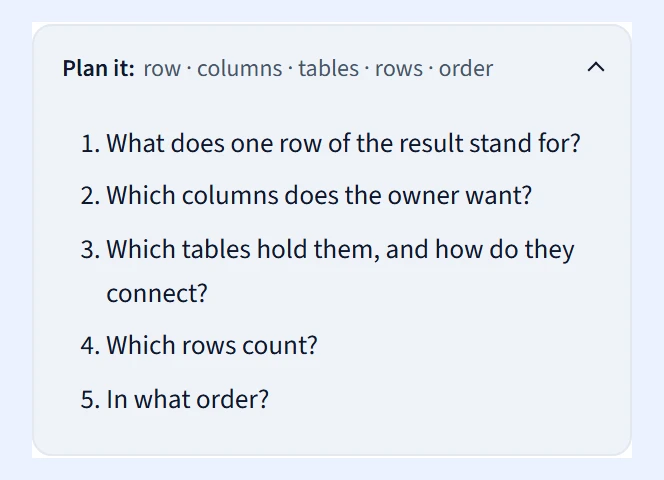
Plan it
Break down the question before you write the SQL.
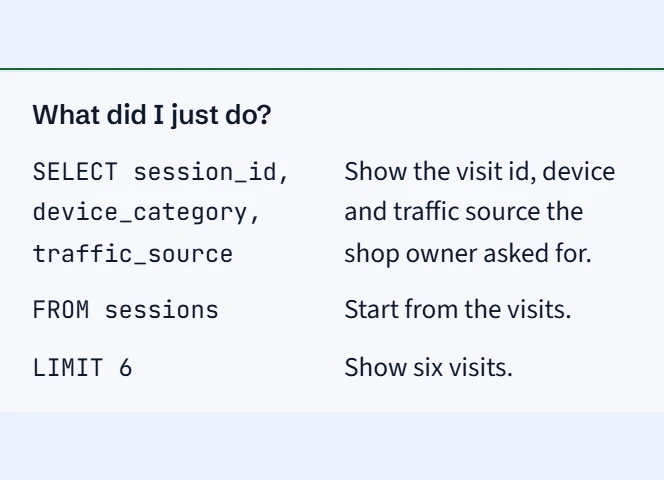
What did I just do?
After a correct answer, see what each SQL clause did.
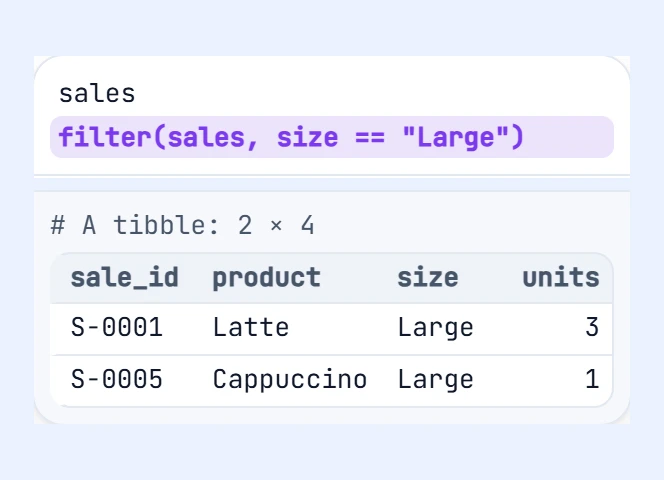
Step-through examples
Move one step at a time and watch the table change.
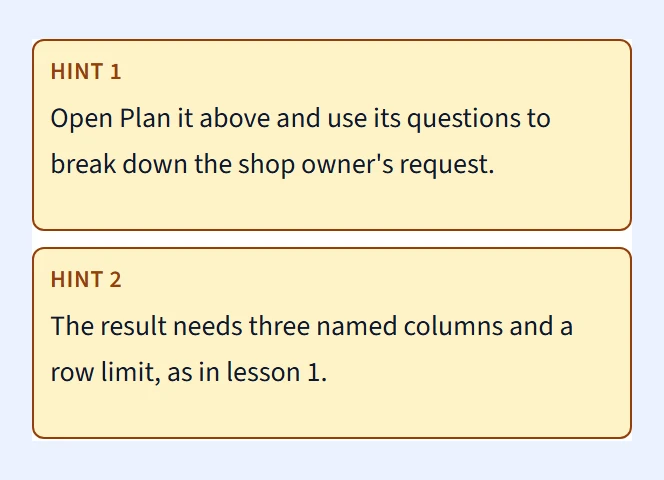
Hints when you need them
Get a nudge, try again and check your understanding.
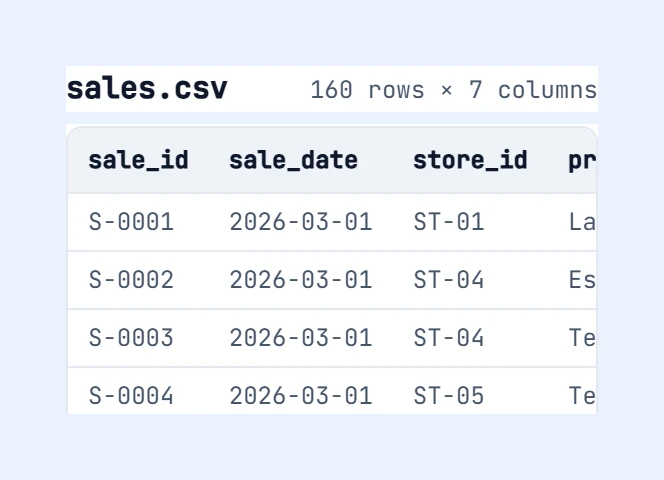
Datasets beside your code
Inspect the columns and first rows without leaving the lesson.
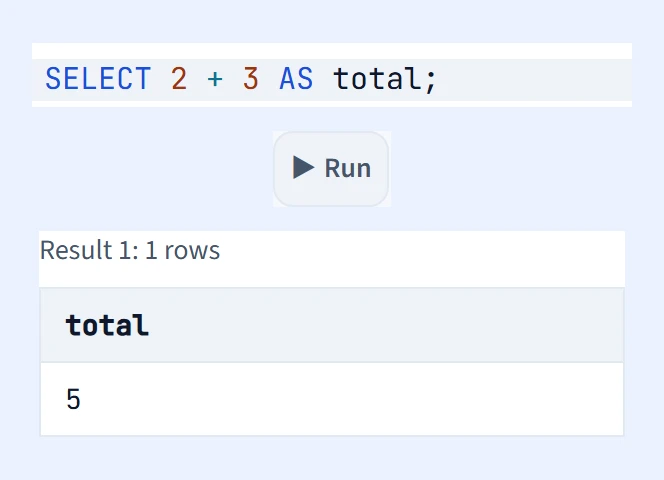
Run it in your browser
Write code and inspect its output, with nothing to install.


Also live: progress saved in this browser, a guided tour, and feedback and problem reporting.
Next
Being builtIn-lesson feature tips
Find the right tool as you work through a lesson.
Later
PlannedAn AI helper in lessons
Explains errors and output, never the answer.
A command-line checker
Run exercises on your own machine for Git and command-line courses.